


SQL B.I Dashboard

SQL Business Intelligence Dashboard
Cumulative & Detailed Breakdown of Sales
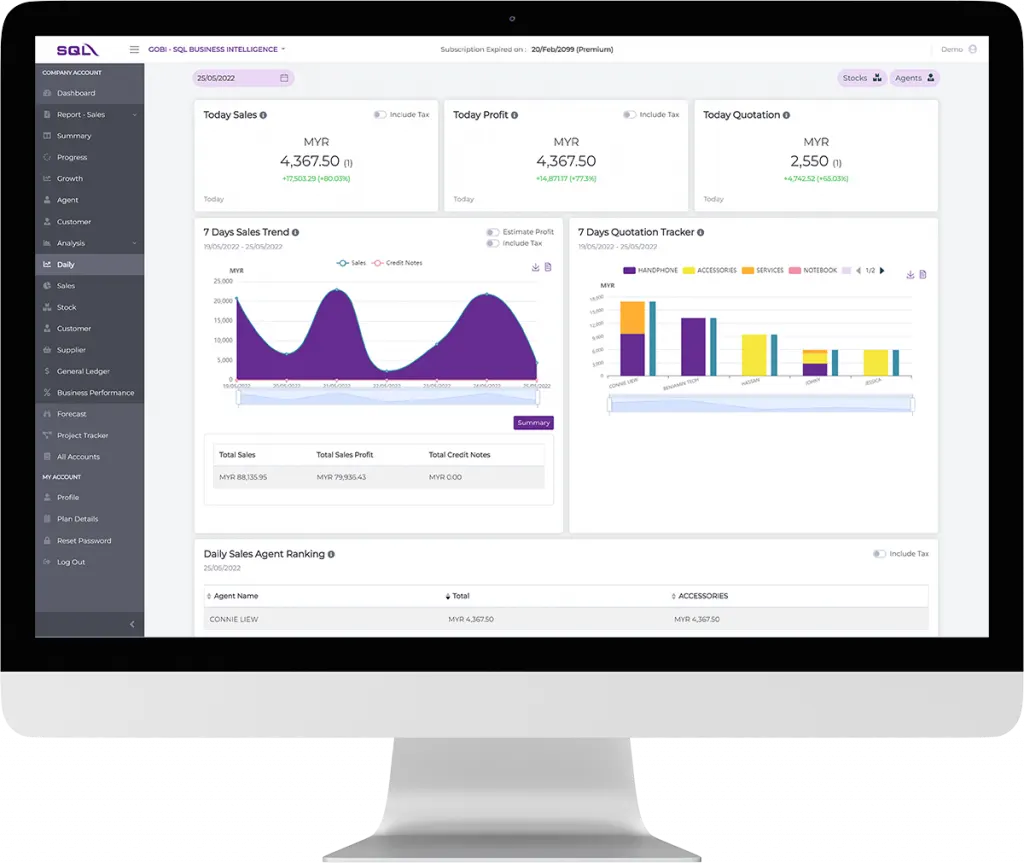
Use SQL Dashboard to get a summarized and detailed preview of all your sales data.
Review your daily business performance by studying your daily levels of sales, profits, product group performance, number of quotation documents issued, converted, pending.
SQL Dashboard also shows you the comparison between this year vs last year by sales amount or by margin, top selling products, top sales customers analysis are all available.
This is proven useful for performance monitoring and achieving short term goals.
Sales Analysis Reports
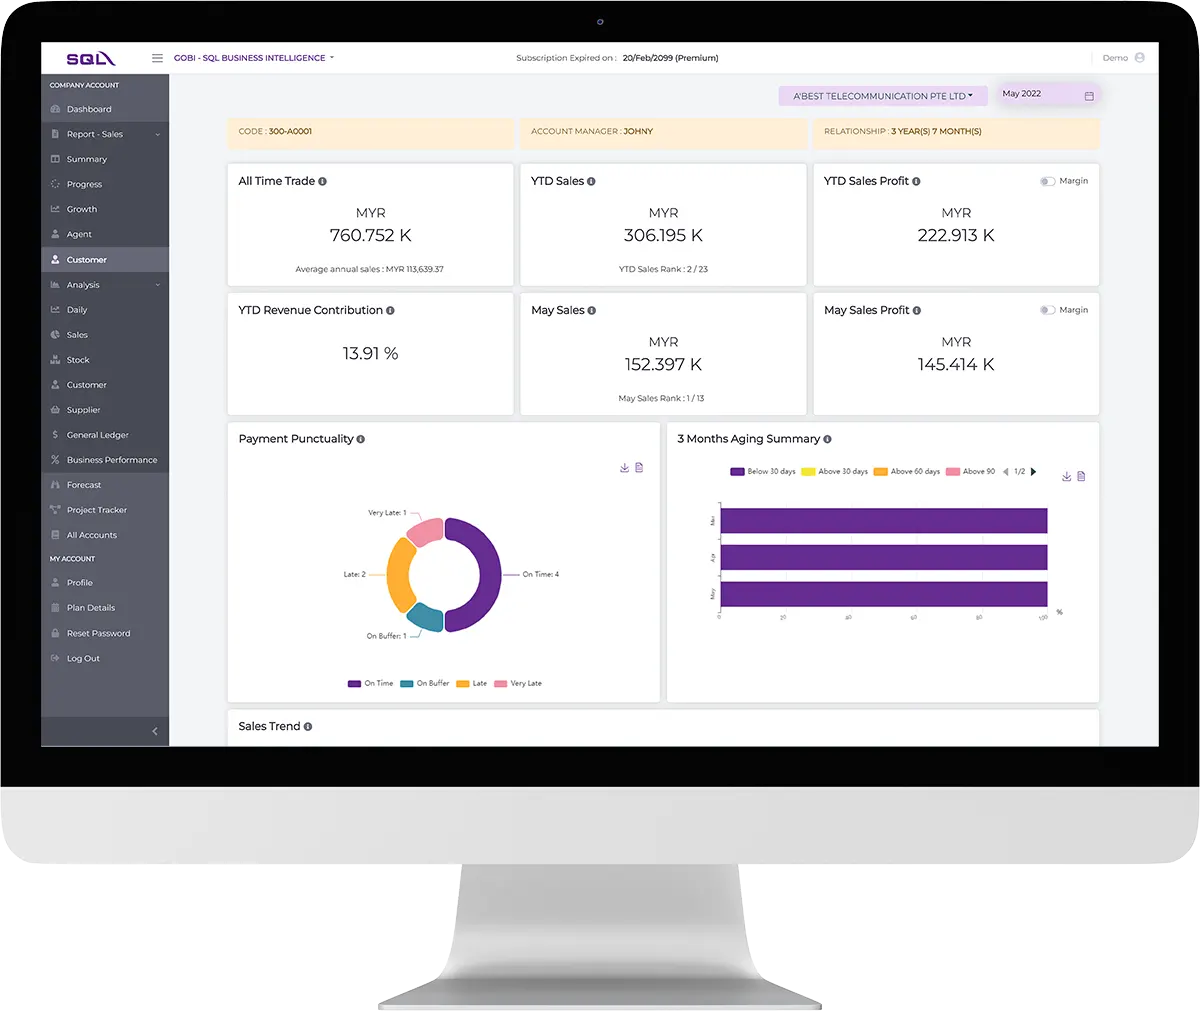
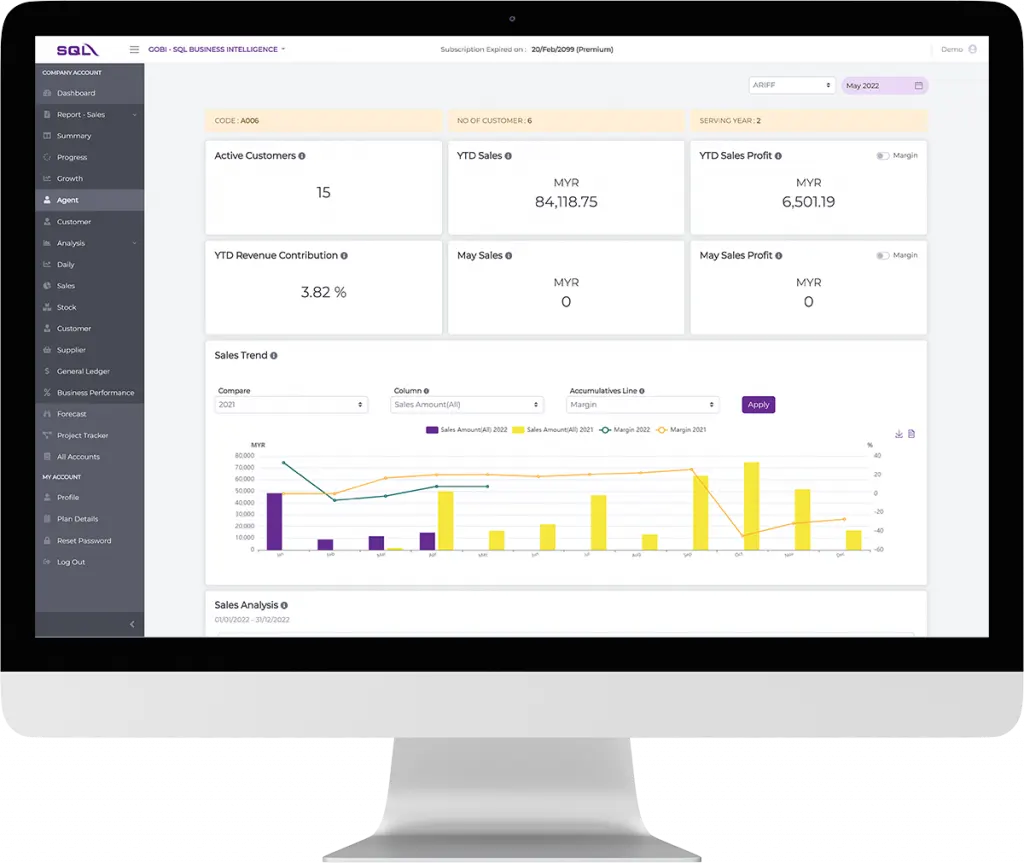
Evaluate Staff's Performance
Monitor Company's Growth
The Dashboard shows you the number of new, old and existing customers. You can track your business growth with his dashboard. Dashboard also shows you the geographical breakdown of your customers location. Knowing where your customers are coming from can help you market your products in a way that is relevant with majority of your customers.
